Introduction
Joint distribution, also known as joint probability distribution, calculates the likelihood of two events occurring together and at the same point in time. Joint probability is the probability that two events can occur simultaneously. Probability is a branch of mathematics which deals with the occurrence of a random event. In simple words it is the likelihood of a certain event. This concept is used a lot in statistical analysis, but it can also be used in machine learning as a classification strategy to produce generative models.
Also Read: What is Argmax in Machine Learning?
What are Joint Distribution, Moment, and Variation?
Probability is very important in the field of data science. It is quantified as a number between 0 and 1 inclusive, where 0 indicates an impossible chance of occurrence and 1 denotes the certain outcome of an event. For example, the probability of drawing a red card from a deck of cards is 1/2 = 0.5. This means that there is an equal chance of drawing a red and drawing a black; since there are 52 cards in a deck, of which 26 are red and 26 are black, there is a 50-50 probability of drawing a red card versus a black card.
When creating algorithms data scientists will often need to come up with inferences based on statistics. This would then be used to help predict or analyze data better. Statistical inference refers to process that is used to find the properties that exist in a probability distribution. One such distribution is known as joint distribution or joint probability.
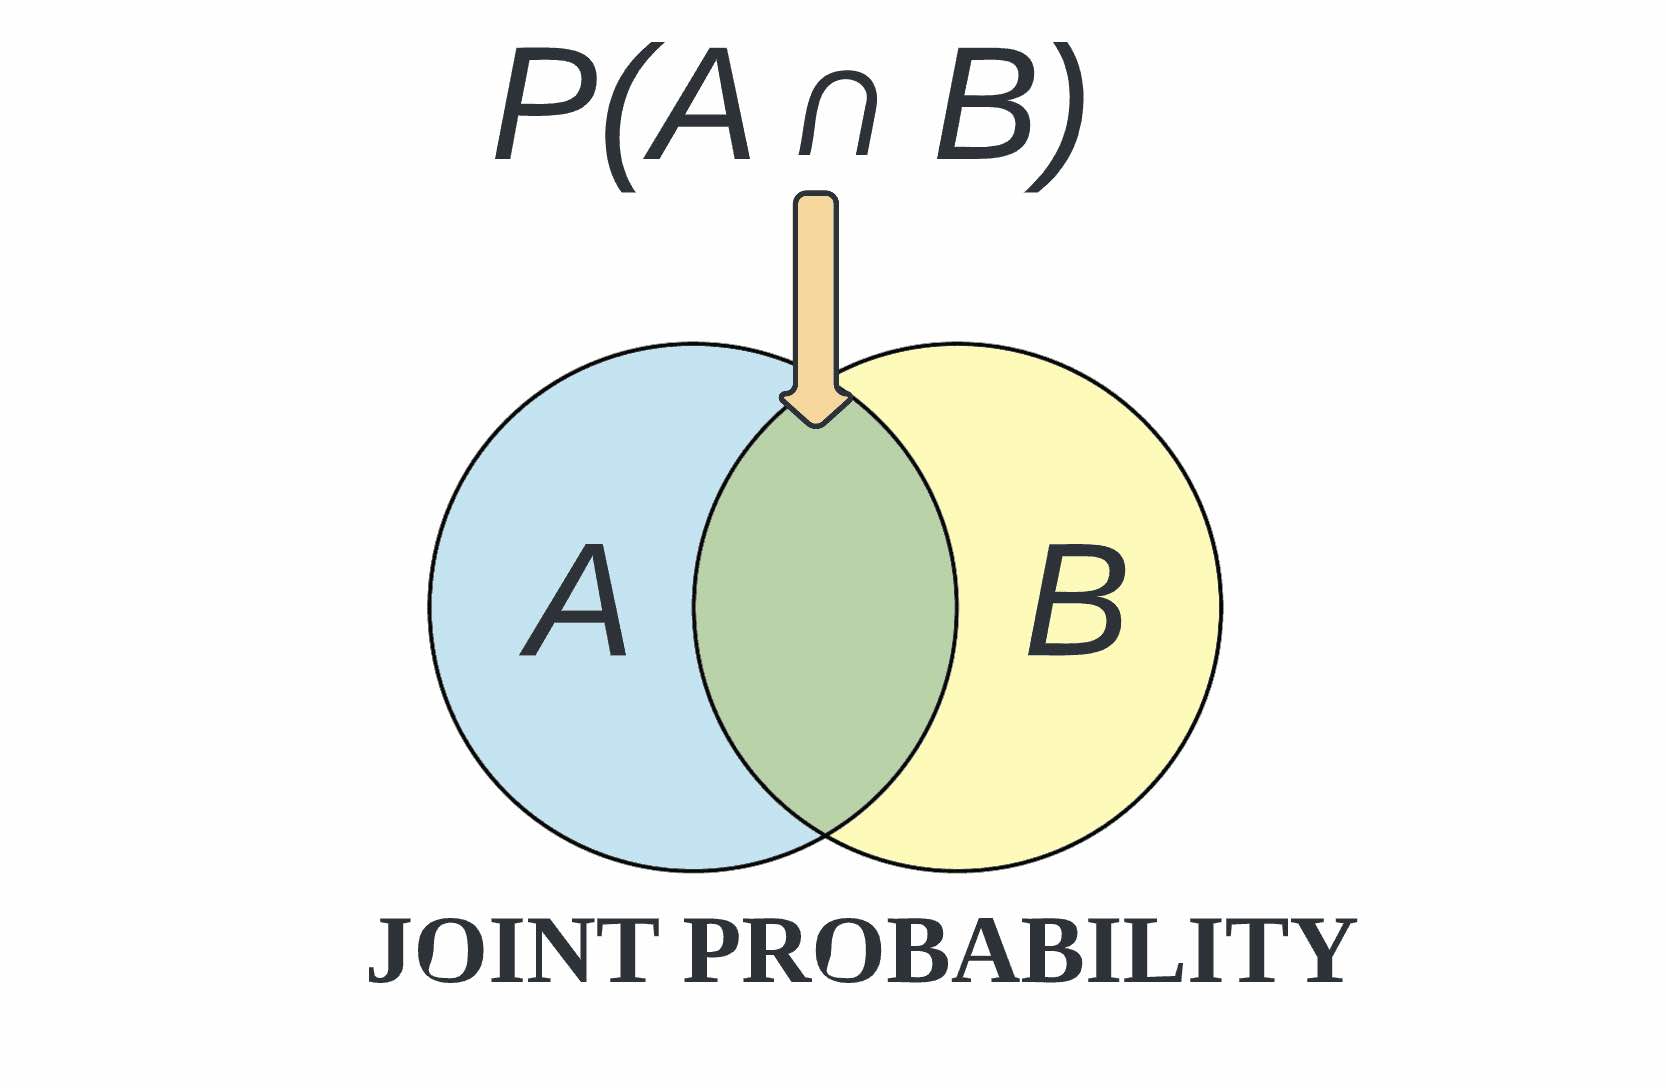
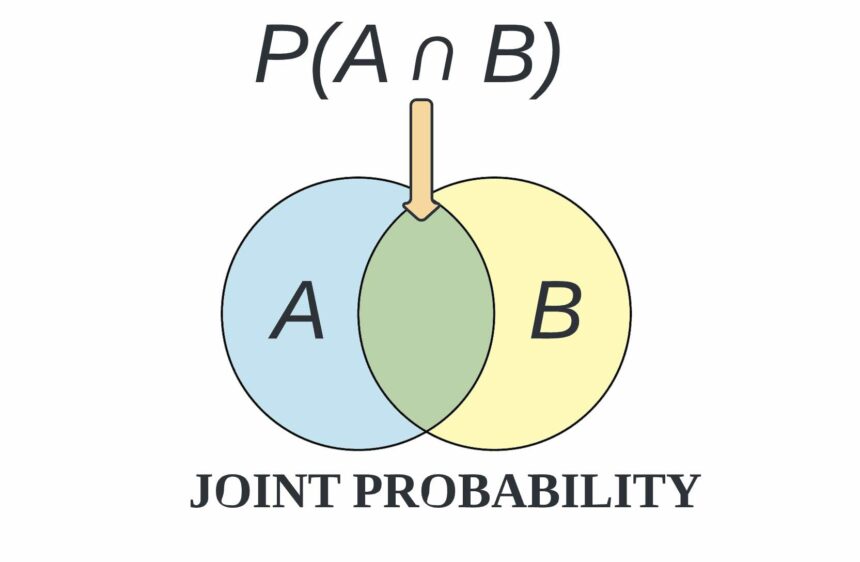
Joint probability can be defined as the chance that two or more events will occur at the same time. The two events are usually designated event A and event B. In probability terminology, it can be written as p(A and B). Hence, joint probability is the probability that two events can occur simultaneously.
Joint probability can also be described as the probability of the intersection or domain discrepancy of two or more events. This is written in statistics as p(A ∩ B). Joint distribution matching across subjects is used in machine learning to help identify a relationship that may or may not exist between two random variables. Joint probability distribution can only be applied to situations where more than one observation can occur at the same time.
For example, from a deck of 52 cards, the joint probability of picking up a card that is both red and 6 is P(6 ∩ red) = 2/52 = 1/26, since a deck of cards has two red sixes—the six of hearts and the six of diamonds.
Every now and then, in machine learning literature, the terms “first moment” and “second moment” will pop up. So what does moment refer to in the context of machine learning? In short, the first moment of a set of numbers is just the mean, or average, and the second moment is usually just the variance. The variance is the mean squared difference between each data point and the center of the distribution measured by the mean.
Suppose you have four numbers (x0, x1, x2, x3). The first raw moment is (x0^1 + x1^1 + x2^1 + x3^1) / 4 which is nothing more than the average. For example, if your four numbers are (2, 3, 6, 9) then the first raw moment is
(2^1 + 3^1 + 6^1 + 9^1) / 4 = (2 + 3 + 6 + 9) / 4 = 20/4 = 5.0
In other words, to compute the raw first moment of a set of numbers, you raise each number to 1, sum, then divide by the number of numbers. The second raw moment of a set of numbers is just like the first moment, except that instead of raising each number to 1, you raise to 2, also known as squaring the number.
Put another way, the second raw moment of four numbers is (x0^2 + x1^2 + x2^2 + x3^2) / 4. For (2, 3, 6, 9) the second raw moment is
(2^2 + 3^2 + 6^2 + 9^2) / 4 = (4 + 9 + 36 + 81) / 4 = 130/4 = 32.5.
In addition to the first and second raw moments, there’s also a central moment where before raising to a power, you subtract the mean.
For example, the second central moment of four numbers is [(x0-m)^2 + (x1-m)^2 + (x2-m)^2 + (x3-m)^2] / 4. For (2, 3, 6, 9), the second central moment is
[(2-5)^2 + (3-5)^2 + (6-5)^2 + (9-5)^2] / 4 = (9 + 4 + 1 + 16) / 4 = 30/4 = 7.5
Which is the population variance of the four numbers. We don’t calculate the first central moment because it will always be zero. The overall purpose of moments in machine learning are too tell us certain properties of a distribution such as the mean, time domain features, effective features, and how skewed the distribution is.
Variation or variance is also important in machine learning as it may appear in classification results, and helps to deduce joint distribution discrepancies. While discussing model accuracy and classification performance, we need to keep in mind the prediction errors, which include bias and variance, that will always be associated with any effective machine learning model. There will always be a slight difference in what our target samples and the source samples. These differences are called errors.
The goal of an analyst is not to eliminate errors but to reduce them. Bias is the difference between our actual and predicted values. Bias is the simple assumptions that our model makes about our data to be able to predict new data. When the Bias is high, assumptions made by our model are too basic, the model can’t capture the important features of our data. This means that our model hasn’t captured patterns in the training data and hence cannot perform well on the testing data too. If this is the case, our model cannot perform on new data and cannot be sent into production. This instance, where the model cannot find patterns in our training set and hence fails for both seen and unseen data, is called underfitting.
Variance is the very opposite of Bias. During training, it allows our model to see the data a certain number of times to find patterns in it. If it does not work on the data for long enough, it will not find patterns and bias occurs. On the other hand, if our model is allowed to view the data too many times, it will learn very well for only that data. It will capture most patterns in the data, but it will also learn from the unnecessary data present, or from the noise. We can define variance as the model’s sensitivity to fluctuations in the data.
Our model may learn from noise. This will cause our model to consider trivial features as important. High variance in a batch of training samples leads to a machine learning model overfitting. For any model, we have to find the perfect balance between Bias and Variance. This just ensures that we capture the essential patterns in our model while ignoring the noise present it in. This is called Bias-Variance Tradeoff. It helps optimize the error in our model and keeps it as low as possible. An optimized model will be sensitive to the patterns in our data, but at the same time will be able to generalize to new data.


